


Interstate Gun Trafficking Mythology
![]()
Guy Smith is the author of the invaluable and in-depth work "Gun Facts", a 'must read' for everyone. We publish below a new piece of research from him, concerning from where crime guns come, debunking the claim that states with "lax" gun control laws are the source for guns in states with "strict" laws. Share this widely.
Posted on 2015/01/29 by Guy Smith. Source Page
Why “lax” gun control states don’t send guns to “strict” states
Most crime guns come from the state where the crime was committed. For states with strict gun control laws, most come from other “strict law” states.
You would not know this if you listened to the gun control industry. They routinely claim that states with “weak gun laws” are the source for guns used in crime. Nationally this theory is nonsense, and it doesn’t even hold up well for states with strict gun laws.
Background
The claim is simple and designed to generate voter fear in places where gun owner rights are not well represented. The insinuation is that states where gun control laws are not burdensome are the source for guns in states where such laws are onerous.
There is no doubt that in a free country where people roam at will, guns follow with them. But they mainly follow legal channels when people relocate from one state to another. If you lived in Florida, bought a gun at retail, moved to Massachusetts, legally sold the gun and it was later used in a crime, then that firearm is listed as an “interstate trafficked gun from a weak gun law state” according to the gun control industry.
What Do We Really Know
 First, we know that across the country crime guns most commonly come from (a) the state in which the crime was committed and (b) neighboring states. The latter is interesting because people rarely make big jumps when they relocate – they tend to move into states with similar climate, culture and industries (I’m a rare bird having jumped from Florida, to Virginia and then to California). The map above shows where firearms used in Maryland crimes come from, and you will notice that for practical purposes, they all come from Maryland’s eastern coast region.
We also know that crime guns tend to be old. On average, a gun used in a crime was sold at a retail outlet more than eleven (11) years before it was recovered at a crime scene (it might have been used in previous crimes, but there is no good way of knowing this). This time lag indicates that few crime guns were purchased at retail for the purpose of committing crimes. We know this to be true because the Bureau of Justice Statistics notes that 40% of crime guns come from completely unregulated, black market street sources (more than 25% are exchanged as part of the drug trade).
Together – guns being old and largely bought in the same state where the crime was committed – this means that the myth of weak gun states is a shabby theory. That guns mainly come from their home states is enough to nail the lid on this rhetorical coffin.
But we can prove it a bit more.
The Top and Bottom States
Since I like picking on the Brady Campaign (and Law Center to Prevent Gun Violence) propaganda scorecard of state laws, we’ll use that as our basis for analysis. Using the 2013 Brady Campaign State Scorecard, I took the top and bottom ranked states given Brady’s wish list of gun control laws (which we have proven time and again have zero bearing on violent crime). Then using the 2013 reports from the Bureau of Alcohol, Tobacco and Firearms, or BATF (which sounds like an entertainment publication for Baltimore) we tallied up the number of crime guns that were originally retailed in the state, and those that in significant numbers came from out of state, using the BATF’s own reports. We then tallied the number from the ten states with the lowest score on the Brady State Scorecard.
NOTE: In this quick-and-dirty analysis, we examine the top-and bottom states. The reason is the (a) the top six states according the Brady Campaign all have a “passing” grade of 60 or above and (b) the 7th state is Hawaii, which due to being a volcanic spec in the middle of an ocean changes the dynamics of interstate transportation of anything, much less guns.
Most guns come from within the states: Averaged, the six most restrictive states have more guns originating inside their borders than outside. Oddly California (#1 on the Brady State Scorecard) which neighbors Arizona (#50) had a lower ratio of imported crime guns than the national average of the top six Brady states, with a whopping 249% more of their crime guns coming from within their borders as opposed to outside of their borders.
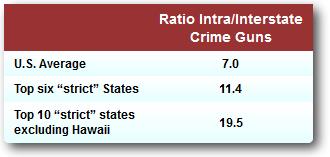 “Lax gun control law” states are not a big problem: Nationally, the ratio for in-state retailed crime guns to the ten states with the most “lax gun laws” according to the Brady State Scorecard was 7:1. For the top six states with Brady’s strictest gun laws, the ratio jumps to 11:1. In other words, fewer guns from “lax law” states find their way to “strict law” states. The ratio climbs even higher when we look at the ten states with the strictest gun control laws (excluding the geographically isolated Hawaii). Thus the claim that states with freer gun owner rights jeopardize states with strict laws is flapdoodle (how’s that for an antique term).
Trafficking is barely on the radar: In the same BATF report, they list how many of the traces were for gun trafficking investigations. In the top ten “strict law” states, a mere 0.6% of traces were for suspected gun smuggling, indicating that the local cops are not finding many violators in the act. Nationally cops agree, devoting only 0.4% of their trace requests to gun smuggling.
Time is the big variable: States with the strictest gun control had the longest time between when a gun was sold at retail (regardless of where it was retailed) and when it was used in crime, with a “time to crime” of 13.8 years from retail to criminal misuse. This diminishes the claim that trafficking is a large source of crime guns because traffickers (what few there actually are) move their merchandise quickly.
The guns being used: Interestingly, many of the “strict law” states have unexpected surges in the types of guns least commonly used in crimes (the favorites of thugs everywhere are the standard revolver or medium caliber pistol). California traced 25% more crime rifles than the national average, and Maryland is 38% higher. Maryland criminals used 58% more shotguns. Derringers were quite popular in Connecticut (25% higher), Massachusetts (21%) and New York (35%).
Time plus type: One possible reality is that because so few guns are being trafficked from “lax law” states to “strict law” states, criminals are actively recycling the guns still available in the state – aging rifles, shotguns and derringers.
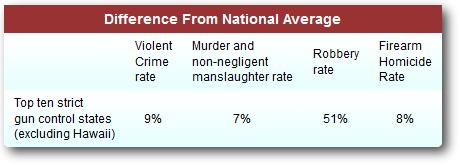 Violent crime is bigger in strict states: This all would be amusing except that violent crime is 9% above national averages in “strict law” states, and even firearm homicides are 8% higher.
Strict States Export to Strict States
 While prowling through the numbers, I decided to see how many states receive an unusually large number of crime guns from “strict” law states. Knowing that ratio from home-bought to “lax” law state guns if 7:1, we looked for states with a worse (lower) ratio for guns from “strict” law states.
I was stunned.
It appears that “strict gun control” states often get most of their guns from other strict states. Indeed, most top ten “strict” states got as many or more guns from other strict states as they did from their own retail stores.
So, compared to the ratio of guns from “weak” gun control states, the problem of crime guns it more closely tied to gun ownership restrictions. Maybe the associated criminal political classes in those states have something to do with it.
The Troubling Facts
Bottom line: States with “strict gun control laws” don’t get many guns from states with very “lax gun control laws”. Yet they have more guns that have been in circulation a long time and that came from their own state and other states with strict gun control laws. For all their legislation, and the endangerment of their citizens by inconveniencing or restricting the options for self-defense, these same states have high violent crime rates.
Most guns move from state to state as a normal function of human migration. Government studies of trafficking show that to be a minor factor in crime guns. Give this and the ratios seen between strong/lax state gun laws, and given that 40% or more of crime guns come from street sources (which are inherently local), the entire campaign to vilify one or another’s states laws – on the failed hypothesis of crime gun trafficking due to “weak gun control laws” – is rejected.
Precautions:
- BATF firearm traces may not be accurate. Guns traced at a crime scene may not have been used in crimes, and guns used in crimes may not have been traced.
- We only sampled the top- and bottom states to contrast what are allegedly the toughest and least tough states for gun control..
- Since the Brady State Scorecard is a completely arbitrary ranking, the basis of analysis exposes nothing about the efficacy of state laws. We hope to cross-compare the Brady Scorecard with a proposed Gun Facts Scorecard in the near future.
- Never confuse covariance with causation. If you see other covariance in the data, be sure to run standard statistical tests before jumping to a conclusion.
Sources
CRIME GUN SOURCE DATA: Firearms Trace Data – 2013, Bureau of Alcohol, Tobacco, Firearms and Explosives, www.atf.gov/content/About/statistics/firearms-trace-data-2013
CRIME STATISTICS: FBI Uniform Crime Reporting database, www.ucrdatatool.gov
![]()